顯示具有 chart 標籤的文章。 顯示所有文章

2022/9/19

VEGA-lite

vega 是一種描述圖表的語法,符合 JSON spec。d3.js 是比較低階的語法,需要用 javascript 處理。vega 只需要 JSON 文件,就撰寫出各式圖表。如果只需要一些常用的圖表,還可以使用 vega-lite,會比 vega 更簡捷。

vega 跟 d3.js 一樣,也是 Washington Interactive Data Lab 開發的,所以 vega 的底層是 d3.js。vega 並不是要取代 d3.js,而是在 d3.js 的基礎上,提供更高階的圖表語言。而且 JSON 更容易用程式碼產生出來。

可以直接從 Example Gallery | Vega-Lite 查看支援的圖表,然後根據自己想要使用的圖表,看範例去修改。

BarChart

Simple bar chart

{
  "$schema": "https://vega.github.io/schema/vega-lite/v5.json",
  "description": "A simple bar chart with embedded data.",
  "data": {
    "values": [
      {"a": "A", "b": 28}, {"a": "B", "b": 55}, {"a": "C", "b": 43},
      {"a": "D", "b": 91}, {"a": "E", "b": 81}, {"a": "F", "b": 53},
      {"a": "G", "b": 19}, {"a": "H", "b": 87}, {"a": "I", "b": 52}
    ]
  },
  "mark": "bar",
  "encoding": {
    "x": {"field": "a", "type": "nominal", "axis": {"labelAngle": 0}},
    "y": {"field": "b", "type": "quantitative"}
  }
}

render

Arrgegate Bar Chart

{
  "$schema": "https://vega.github.io/schema/vega-lite/v5.json",
  "description": "A bar chart showing the US population distribution of age groups in 2000.",
  "height": {"step": 17},
  "data": { "url": "https://vega.github.io/vega-lite/examples/data/population.json"},
  "transform": [{"filter": "datum.year == 2000"}],
  "mark": "bar",
  "encoding": {
    "y": {"field": "age"},
    "x": {
      "aggregate": "sum", "field": "people",
      "title": "population"
    }
  }
}

render

Group Bar Chart

{
  "$schema": "https://vega.github.io/schema/vega-lite/v5.json",
  "data": {
    "values": [
      {"category":"A", "group": "x", "value":0.1},
      {"category":"A", "group": "y", "value":0.6},
      {"category":"A", "group": "z", "value":0.9},
      {"category":"B", "group": "x", "value":0.7},
      {"category":"B", "group": "y", "value":0.2},
      {"category":"B", "group": "z", "value":1.1},
      {"category":"C", "group": "x", "value":0.6},
      {"category":"C", "group": "y", "value":0.1},
      {"category":"C", "group": "z", "value":0.2}
    ]
  },
  "mark": "bar",
  "encoding": {
    "x": {"field": "category"},
    "y": {"field": "value", "type": "quantitative"},
    "xOffset": {"field": "group"},
    "color": {"field": "group"}
  }
}

render

Stacked Bar Chart

{
  "$schema": "https://vega.github.io/schema/vega-lite/v5.json",
  "data": {"url": "https://vega.github.io/vega-lite/examples/data/seattle-weather.csv"},
  "mark": "bar",
  "encoding": {
    "x": {
      "timeUnit": "month",
      "field": "date",
      "type": "ordinal",
      "title": "Month of the year"
    },
    "y": {
      "aggregate": "count",
      "type": "quantitative"
    },
    "color": {
      "field": "weather",
      "type": "nominal",
      "scale": {
        "domain": ["sun", "fog", "drizzle", "rain", "snow"],
        "range": ["#e7ba52", "#c7c7c7", "#aec7e8", "#1f77b4", "#9467bd"]
      },
      "title": "Weather type"
    }
  }
}

render

Histrogram

{
  "$schema": "https://vega.github.io/schema/vega-lite/v5.json",
  "data": {"url": "https://vega.github.io/vega-lite/examples/data/movies.json"},
  "mark": "bar",
  "encoding": {
    "x": {
      "bin": true,
      "field": "IMDB Rating"
    },
    "y": {"aggregate": "count"}
  }
}

render

ScatterPlot

{
  "$schema": "https://vega.github.io/schema/vega-lite/v5.json",
  "description": "A scatterplot showing horsepower and miles per gallons for various cars.",
  "data": {"url": "https://vega.github.io/vega-lite/examples/data/cars.json"},
  "mark": "point",
  "encoding": {
    "x": {"field": "Horsepower", "type": "quantitative"},
    "y": {"field": "Miles_per_Gallon", "type": "quantitative"}
  }
}

render

LineChart

{
  "$schema": "https://vega.github.io/schema/vega-lite/v5.json",
  "description": "Stock prices of 5 Tech Companies over Time.",
  "data": {"url": "https://vega.github.io/vega-lite/examples/data/stocks.csv"},
  "mark": {
    "type": "line",
    "point": true
  },
  "encoding": {
    "x": {"timeUnit": "year", "field": "date"},
    "y": {"aggregate":"mean", "field": "price", "type": "quantitative"},
    "color": {"field": "symbol", "type": "nominal"}
  }
}

render

AreaChart

{
  "$schema": "https://vega.github.io/schema/vega-lite/v5.json",
  "width": 300,
  "height": 200,
  "data": {"url": "https://vega.github.io/vega-lite/examples/data/unemployment-across-industries.json"},
  "mark": "area",
  "encoding": {
    "x": {
      "timeUnit": "yearmonth", "field": "date",
      "axis": {"format": "%Y"}
    },
    "y": {
      "aggregate": "sum", "field": "count",
      "title": "count"
    }
  }
}

render

Table-based Plots

{
  "$schema": "https://vega.github.io/schema/vega-lite/v5.json",
  "data": {"url": "https://vega.github.io/vega-lite/examples/data/cars.json"},
  "mark": "rect",
  "encoding": {
    "y": {"field": "Origin", "type": "nominal"},
    "x": {"field": "Cylinders", "type": "ordinal"},
    "color": {"aggregate": "mean", "field": "Horsepower"}
  },
  "config": {
    "axis": {"grid": true, "tickBand": "extent"}
  }
}

render

Circulat Plots

PieChart

{
  "$schema": "https://vega.github.io/schema/vega-lite/v5.json",
  "description": "A simple pie chart with labels.",
  "data": {
    "values": [
      {"category": "a", "value": 4},
      {"category": "b", "value": 6},
      {"category": "c", "value": 10},
      {"category": "d", "value": 3},
      {"category": "e", "value": 7},
      {"category": "f", "value": 8}
    ]
  },
  "encoding": {
    "theta": {"field": "value", "type": "quantitative", "stack": true},
    "color": {"field": "category", "type": "nominal", "legend": null}
  },
  "layer": [{
    "mark": {"type": "arc", "outerRadius": 80}
  }, {
    "mark": {"type": "text", "radius": 90},
    "encoding": {
      "text": {"field": "category", "type": "nominal"}
    }
  }]
}

render

References

用 VEGA 資料視覺化

A High-Level Grammar of Interactive Graphics | Vega-LiteA High-Level Grammar of Interactive Graphics | Vega-Lite

2022/9/8

flowchat.js

MarkText 除了能用 mermaid 的 flowchart 以外,還支援 flowchart.js

語法

[] 裡面的 item 是 optional

nodeName=>nodeType: nodeText[|flowstate][:>urlLink]

nodeName 是 node variable

nodeType 定義該 node 的類型

nodeText 是 node 裡面的文字

flowstate 為 optional,用 |指定多個 style

urlLink 為 optional,用 :> 指定 link,在 MarkText 裡面,link 沒有作用。但輸出為 pdf 後,可在pdf 裡面的圖表上使用 link,連接到該網頁。

Node Types

start 為 first node

end 為 last node

operatoin 是方塊文字,代表一個動作

inputoutput 是 IO

subroutine 是另一個 flowchart

condition 為 logical condition

parallel 是同時發生的兩個 flow

Connections

<node variable name>[(<specification1>[, <specification2])]-><node variable name>[[(<specification1>[, <specification2])]-><node variable name>]

[] 裡面的 item 是 optional

用 -> 連接 nodes

ex:

nodeVar1->nodeVar2
nodeVar2->nodeVar3

或
nodeVar1->nodeVar2->nodeVar3

Directions

離開 node 的 connection 的方向

  • left

  • right

  • top

  • down

ex:

startVar(<direction>)->nextNode
operationVar(<direction>)->nextNode

conditionalVar(yes, <direction>)->nextNode1
conditionalVar(no,  <direction>)->nextNode2

parallelVar(path1, <direction>)->nextNode1
parallelVar(path2, <direction>)->nextNode2
parallelVar(path3, <direction>)->nextNode3

Example

st=>start: Start:>http://www.google.com[blank]
e=>end:>http://www.google.com
op1=>operation: My Operation
sub1=>subroutine: My Subroutine
cond=>condition: Yes or No?:>http://www.google.com
io=>inputoutput: catch something...
para=>parallel: parallel tasks

st->op1->cond
cond(yes)->io->e
cond(no)->para
para(path1, bottom)->sub1(right)->op1
para(path2, top)->op1

render

References

flowchart.js

GitHub - adrai/flowchart.js: Draws simple SVG flow chart diagrams from textual representation of the diagram

2022/9/5

Mermaid - Class Diagram

classDiagram
      Animal <|-- Duck
      Animal <|-- Fish
      Animal <|-- Zebra
      Animal : +int age
      Animal : +String gender
      Animal: +isMammal()
      Animal: +mate()
      class Duck{
          +String beakColor
          +swim()
          +quack()
      }
      class Fish{
          -int sizeInFeet
          -canEat()
      }
      class Zebra{
          +bool is_wild
          +run()
      }

render

語法

class 包含三個部分

  • 最上面是 class name,第一個字母是大寫

  • 中間是 attributes,第一個字母小寫,可加上類別

  • 最下面是 operations,第一個字母小寫

classDiagram
    class BankAccount
    BankAccount : +String owner
    BankAccount : +Bigdecimal balance
    BankAccount : +deposit(amount)
    BankAccount : +withdrawl(amount)

render

定義 class

  • 關鍵字為 class ex: class Animal

  • 兩個 class 之間有繼承關係 ex: Animal <|-- Dog

classDiagram
    class Animal
    Animal <|-- Dog

render

定義 members

有兩種寫法

classDiagram
 class BankAccount
 BankAccount : +String owner
 BankAccount : +BigDecimal balance
 BankAccount : +deposit(amount)
 BankAccount : +withdrawal(amount)

class BankAccount2{
    +String owner
    +BigDecimal balance
    +deposit(amount)
    +withdrawl(amount)
}

render

method 後面可加上 return type

classDiagram
class BankAccount{
    +String owner
    +BigDecimal balance
    +deposit(amount) bool
    +withdrawl(amount) int
}

GenericType: 在 Java 有時會用到 List<String> 這樣的資料結構,這邊用這樣的語法表示 List~string~

classDiagram
class Square~Shape~{
    int id
    List~Int~ position
    setPoints(List~Int~ points)
    getPoints() List~Int~
}

Square : -List~String~ messages
Square : +setMessages(List~String~ messages)
Square : +getMessages() List~String~

render

Visibility 有四種

  • + Public
  • - Private
  • # Protected
  • ~ Package/Internal

另外可在 method 與 field 後面加上 classifiers

  • * Abstract method e.g.: someAbstractMethod()*
  • $ Static method e.g.: someStaticMethod()$
  • $ Static field e.g.: String someField$

## 定義關係

[classA][Arrow][ClassB]
[classA][Arrow][ClassB]:LabelText
Type Description
<\ --
*-- Composition
o-- Aggregation
--> Association
-- Link (Solid)
..> Dependency
..\ >
.. Link (Dashed)

example : 後面是 label,可不填寫

classDiagram
classA --|> classB : Inheritance
classC --* classD : Composition
classE --o classF : Aggregation
classG --> classH : Association
classI -- classJ : Link(Solid)
classK ..> classL : Dependency
classM ..|> classN : Realization
classO .. classP : Link(Dashed)

render

classDiagram
classA <|-- classB : implements
classC *-- classD : composition
classE o-- classF : association

render

雙向關係

[Relation Type][Link][Relation Type]

Relation Type:

Type Description
<\
* Composition
o Aggregation
> Association
< Association
\ >

Link

Type Description
-- Solid
.. Dashed

cardinality/multiplicity on relations

  • 1 Only 1
  • 0..1 Zero or One
  • 1..* One or more
  • * Many
  • n n {where n>1}
  • 0..n zero to n {where n>1}
  • 1..n one to n {where n>1}

語法

[classA] "cardinality1" [Arrow] "cardinality2" [ClassB]:LabelText

ex:

classDiagram
    Customer "1" --> "*" Ticket
    Student "1" --> "1..*" Course
    Galaxy --> "many" Star : Contains

render

Annotations on classes

用在 interface 或 abstract class

  • <<Interface>> To represent an Interface class
  • <<abstract>> To represent an abstract class
  • <<Service>> To represent a service class
  • <<enumeration>> To represent an enum

ex

classDiagram

class Shape
<<interface>> Shape
Shape : noOfVertices
Shape : draw()

class Color
<<enumeration>> Color
Color: RED
Color: BLUE
Color: GREEN
Color: WHITE
Color: BLACK

render

2022/8/29

Mermaid - State Diagram

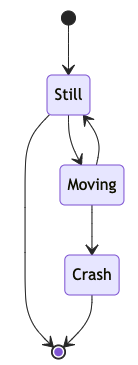
stateDiagram-v2
    [*] --> Still
    Still --> [*]

    Still --> Moving
    Moving --> Still
    Moving --> Crash
    Crash --> [*]

舊版是 stateDiagram,節點看起來比較小,故應該使用 stateDiagram-v2。

States

有三種寫法

stateDiagram-v2
    s1
    state "s2 state description" as s2
    s3 : s3 state description

render 結果

Transition

stateDiagram-v2
    s1 --> s2
    s2 --> s3: A transition

render 結果

Start & End

stateDiagram-v2
    [*] --> s1
    s1 --> [*]

render 結果

Composite State

stateDiagram-v2
    [*] --> First
    First --> Third

    state First {
        [*] --> Second

        state Second {
            [*] --> second
            second --> [*]
        }
    }
    state Third {
        [*] --> third
        third --> [*]
    }

render 結果

Choice

類似流程圖,可判斷選擇路徑

stateDiagram-v2
    state if_state <<choice>>
    [*] --> IsPositive
    IsPositive --> if_state
    if_state --> False: if n < 0
    if_state --> True : if n >= 0

Fork

stateDiagram-v2
    state fork_state <<fork>>
      [*] --> fork_state
      fork_state --> State2
      fork_state --> State3

      state join_state <<join>>
      State2 --> join_state
      State3 --> join_state
      join_state --> State4
      State4 --> [*]

render

Note

在 node 的 right of 或 left of 放上 note

stateDiagram-v2
        State1: The state with a note
        note right of State1
            Important information! You can write
            notes.
        end note
        State1 --> State2
        note left of State2 : This is the note to the left.

render

Concurrency

可用 -- 表示同時發生的 state

stateDiagram-v2
    [*] --> Active

    state Active {
        [*] --> NumLockOff
        NumLockOff --> NumLockOn : EvNumLockPressed
        NumLockOn --> NumLockOff : EvNumLockPressed
        --
        [*] --> CapsLockOff
        CapsLockOff --> CapsLockOn : EvCapsLockPressed
        CapsLockOn --> CapsLockOff : EvCapsLockPressed
        --
        [*] --> ScrollLockOff
        ScrollLockOff --> ScrollLockOn : EvScrollLockPressed
        ScrollLockOn --> ScrollLockOff : EvScrollLockPressed
    }

render

Direction

將圖表方向由上下改為 LR, MarkText 不支援 direction

stateDiagram
    direction LR
    [*] --> A
    A --> B
    B --> C
    state B {
      direction LR
      a --> b
    }
    B --> D

2022/8/22

Mermaid - Sequence Diagram

mermaid 支援 UML 中的 sequence diagram

Syntax

Participants 明確標示參與的角色,以方框表示

sequenceDiagram
    participant Alice
    participant John
    Alice->>John: Hello John, how are you?
    John-->>Alice: Great!
    Alice->>John: See you later!

render

participant 可替換為 actor,會改成用 UML 代表人物的 actor 表示。(MarkText 不支援 actor 語法)

sequenceDiagram
    actor Alice
    actor Bob
    Alice->>Bob: Hi Bob
    Bob->>Alice: Hi Alice

alias 是 actor 的縮寫 ex: participant A as Alice

sequenceDiagram
    participant A as Alice
    participant J as John
    A->>J: Hello John, how are you?
    J->>A: Great!

render

Message

可用實線或虛線,語法為

[Actor][Arrow][Actor]:Message text

Arrow 的部分有六種

Type Description
-> Solid line without arrow
--> Dotted line without arrow
->> Solid line with arrowhead
-->> Dotted line with arrowhead
-x Solid line with a cross at the end
--x Dotted line with a cross at the end.
-) Solid line with an open arrow at the end (async)
--) Dotted line with a open arrow at the end (async)
sequenceDiagram
    participant A as Alice
    participant J as John
    A->J: M1
    A-->J: M2
    A->>J: M3
    A-->>J: M4
    A-xJ: M5
    A--xJ: M6
    %%A-)J: M7
    %%A--)J: M8

render

Activations

可 activate/deactivate actor,在 Sequence Diagram 裡面代表該 actor 花時間處理一些工作,語法為 activate/deactivate,也可在 message arrow 後面使用 + -。

activatation 可在同一個 actor 裡面 stacked

sequenceDiagram
    Alice->>John: Hello John, how are you?
    activate John
    John-->>Alice: Great!
    deactivate John

    Alice->>+John: Hello John, how are you?
    John-->>-Alice: Great!

    Alice->>+John: Hello John, how are you?
    Alice->>+John: John, can you hear me?
    John-->>-Alice: Hi Alice, I can hear you!
    John-->>-Alice: I feel great!

render

Note

可在 sequence diagram 加上 note,

Note [ right of | left of | over ] [Actor]: Text in note content

sequenceDiagram
    participant John
    Note right of John: Text of John
    Alice->John: Hello John, how are you?
    Note over Alice,John: A Note Over Alice, John

render

Loop

語法為

loop Loop text
... statements ...
end
sequenceDiagram
    Alice->John: Hello John, how are you?
    loop Every minute
        John-->Alice: Great!
    end

render

Alt

代表 alternative path,以下為語法,可不寫 else

alt Describing text
... statements ...
else
... statements ...
end
sequenceDiagram
    Alice->>Bob: Hello Bob, how are you?
    alt is sick
        Bob->>Alice: Not so good :(
    else is well
        Bob->>Alice: Feeling fresh like a daisy
    end
    opt Extra response
        Bob->>Alice: Thanks for asking
    end

render

Parallel

同時發生的動作

par [Action 1]
... statements ...
and [Action 2]
... statements ...
and [Action N]
... statements ...
end

example

sequenceDiagram
    par Alice to Bob
        Alice->>Bob: Hello guys!
    and Alice to John
        Alice->>John: Hello guys!
    end
    Bob-->>Alice: Hi Alice!
    John-->>Alice: Hi Alice!

render

可以 nest parallel blocks

sequenceDiagram
    %% 可 nest parallel blocks
    par Alice to Bob
        Alice->>Bob: Go help John
    and Alice to John
        Alice->>John: I want this done today
        par John to Charlie
            John->>Charlie: Can we do this today?
        and John to Diana
            John->>Diana: Can you help us today?
        end
    end

render

hightlight 背景

以 rgb 或 rgba 定義顏色

rect rgb(0, 255, 0)
... content ...
end

rect rgba(0, 0, 255, .1)
... content ...
end

example

sequenceDiagram
    participant Alice
    participant John

    rect rgb(191, 223, 255)
    note right of Alice: Alice calls John.
    Alice->>+John: Hello John, how are you?
    rect rgb(200, 150, 255)
    Alice->>+John: John, can you hear me?
    John-->>-Alice: Hi Alice, I can hear you!
    end
    John-->>-Alice: I feel great!
    end
    Alice ->>+ John: Did you want to go to the game tonight?
    John -->>- Alice: Yeah! See you there.

render

Sequence Number

autonumber

sequenceDiagram
    autonumber
    Alice->>John: Hello John, how are you?
    loop Healthcheck
        John->>John: Fight against hypochondria
    end
    Note right of John: Rational thoughts!
    John-->>Alice: Great!
    John->>Bob: How about you?
    Bob-->>John: Jolly good!

render

Actor Menu

語法,在 MarkText 不能使用

link <actor>: <link-label> @ <link-url>
sequenceDiagram
    participant Alice
    participant John
    link Alice: Dashboard @ https://dashboard.contoso.com/alice
    link Alice: Wiki @ https://wiki.contoso.com/alice
    link John: Dashboard @ https://dashboard.contoso.com/john
    link John: Wiki @ https://wiki.contoso.com/john
    Alice->>John: Hello John, how are you?
    John-->>Alice: Great!
    Alice->>John: See you later!

render

2022/8/15

Mermaid - Gantt & Pie Chart

Mermaid - Gantt & Pie Chart

Gantt

這是 Gantt Chart 的範例,在圖表中,在今天畫上一條紅色直線。

gantt
    title A Gantt Diagram
    dateFormat  YYYY-MM-DD

    section Section
    A task           :a1, 2022-02-01, 30d
    Another task     :after a1  , 20d

    section Another
    Task in sec      :2022-02-12  , 12d
    another task     : 24d

render

Syntax

以下是 gantt chart 的相關語法

gantt
    dateFormat  YYYY-MM-DD
    title       Adding GANTT diagram functionality to mermaid
    excludes    weekends
    %% (`excludes` accepts specific dates in YYYY-MM-DD format, days of the week ("sunday") or "weekends", but not the word "weekdays".)

    section A section
    Completed task            :done,    des1, 2014-01-06,2014-01-08
    Active task               :active,  des2, 2014-01-09, 3d
    Future task               :         des3, after des2, 5d
    Future task2              :         des4, after des3, 5d

    section Critical tasks
    Completed task in the critical line :crit, done, 2014-01-06,24h
    Implement parser and jison          :crit, done, after des1, 2d
    Create tests for parser             :crit, active, 3d
    Future task in critical line        :crit, 5d
    Create tests for renderer           :2d
    Add to mermaid                      :1d
    Functionality added                 :milestone, 2014-01-25, 0d

    section Documentation
    Describe gantt syntax               :active, a1, after des1, 3d
    Add gantt diagram to demo page      :after a1  , 20h
    Add another diagram to demo page    :doc1, after a1  , 48h

    section Last section
    Describe gantt syntax               :after doc1, 3d
    Add gantt diagram to demo page      :20h
    Add another diagram to demo page    :48h

render

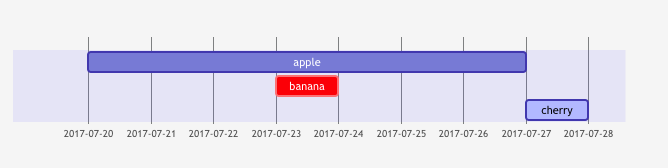
可以用 space 區隔多個 dependencies

gantt
    apple :a, 2017-07-20, 1w
    banana :crit, b, 2017-07-23, 1d
    cherry :active, c, after b a, 1d

render

section 用來區分專案不同的工作部分,section 後面是該 section 的名稱,是一定要填寫的

Milestones

milestone 是一種不同類別的 task,代表特殊的時間點。milestone 的位置是initial date + duration/2

gantt 
dateFormat HH:mm
axisFormat %H:%M
Initial milestone : milestone, m1, 17:49,2min
taska2 : 10min
taska3 : 5min 
Final milestone : milestone, m2, 18:14, 2min

render

Date Format

dateFormat YYYY-MM-DD

可使用以下這些日期格式

Input       Example             Description:
YYYY        2014                4 digit year
YY          14                  2 digit year
Q           1..4                Quarter of year. Sets month to first month in quarter.
M MM        1..12               Month number
MMM MMMM    January..Dec        Month name in locale set by moment.locale()
D DD        1..31               Day of month
Do          1st..31st           Day of month with ordinal
DDD DDDD    1..365              Day of year
X           1410715640.579      Unix timestamp
x           1410715640579       Unix ms timestamp
H HH        0..23               24 hour time
h hh        1..12               12 hour time used with a A.
a A         am pm               Post or ante meridiem
m mm        0..59               Minutes
s ss        0..59               Seconds
S           0..9                Tenths of a second
SS          0..99               Hundreds of a second
SSS         0..999              Thousandths of a second
Z ZZ        +12:00              Offset from UTC as +-HH:mm, +-HHmm, or Z

橫軸的日期格式

axisFormat  %Y-%m-%d

可使用以下日期格式

%a - abbreviated weekday name.
%A - full weekday name.
%b - abbreviated month name.
%B - full month name.
%c - date and time, as "%a %b %e %H:%M:%S %Y".
%d - zero-padded day of the month as a decimal number [01,31].
%e - space-padded day of the month as a decimal number [ 1,31]; equivalent to %_d.
%H - hour (24-hour clock) as a decimal number [00,23].
%I - hour (12-hour clock) as a decimal number [01,12].
%j - day of the year as a decimal number [001,366].
%m - month as a decimal number [01,12].
%M - minute as a decimal number [00,59].
%L - milliseconds as a decimal number [000, 999].
%p - either AM or PM.
%S - second as a decimal number [00,61].
%U - week number of the year (Sunday as the first day of the week) as a decimal number [00,53].
%w - weekday as a decimal number [0(Sunday),6].
%W - week number of the year (Monday as the first day of the week) as a decimal number [00,53].
%x - date, as "%m/%d/%Y".
%X - time, as "%H:%M:%S".
%y - year without century as a decimal number [00,99].
%Y - year with century as a decimal number.
%Z - time zone offset, such as "-0700".
%% - a literal "%" character.

Comments

用 %% 開頭的那一行,都是註解

## Pie Chart

語法,只要直接填寫數值,會自動計算為 Pie Chart 裡面的比例

[pie] [title] [titlevalue] (OPTIONAL)
"[datakey1]" : [dataValue1]
"[datakey2]" : [dataValue2]
"[datakey3]" : [dataValue3]

Example

pie
    title Key elements in Product X
    "Calcium" : 42.96
    "Potassium" : 50.05
    "Magnesium" : 10.01
    "Iron" :  5

render

2022/8/8

Mermaid - Flowchart

Mermaid 是用 text 與 code 撰寫 diagrams 的語法,能夠用在 markdown 的 codeblock 裡面,目前支援的語法有 flowchart, sequence diagram, class diagram, state diagram, entity relationship diagram, gantt chart, user journey diagram。

Mermaid Live Editor 是線上編輯的工具,也可以在 Markdown 工具裡面試試看以沒有支援 mermaid,可在 code block 的 lang 填上 mermaid。

flowchart LR
    A-->B

實際上 render flowchart 會是這樣

Flowchart

Orientation

第一行 flowchart 後面要指定方向

  • TB - top to bottom
  • TD - top-down/ same as top to bottom
  • BT - bottom to top
  • RL - right to left
  • LR - left to right

Node

節點的前面是 id,後面是節點格式及文字

flowchat LR
id1(圓角節點)
id2([stadium-shaped node])
id3[[subroutine shaped node]]
id4[(cylindrical shaped Database)]
id5((circle))
id6{rhombus}
id7{{hexagon}}
id8[/parallelogram/]
id9[\parallelogram alt\]
id10[/trapezoid\]
id11[\trapezoid alt/]

實際上 render 會是這樣

flowchart LR
A --> B
C --- D
E --text on link---F
G --text on link2-->H
I ---|text on link|J
K -->|text on link|L
M -.-> N
O -. dotted link with text .-> P
Q ==> R
S == thick link with text ==> T
U -- chain --> V -- chain --> W
a --> b & c --> d
e & f--> g & h
i --o j
j --x k

實際上 render 會是這樣

特殊字元

用 " 把文字填在裡面,另外可用 #quote; 代表 :,支援 HTML character names

flowchart LR
id1["This is the (text) in the box"]
A["A double quote:#quot;"] -->B["A dec char:#9829;"]

可倍 render 為

flowchart LR
id1["This is the (text) in the box"]
A["A double quote:#quot;"] -->B["A dec char:#9829;"]

subgraph

語法為

subgraph title
    graph definition
end

subgraph subgraphid [title]
    graph definition
end

範例

flowchart TB
    c1-->a2
    d1-->a2
    subgraph one
    a1-->a2
    end

    subgraph two
    b1-->b2
    end

    subgraph sid1 [three]
    c1-->c2
    end

render 結果

flowcharts

可在 flowchart 之間加上 edges

flowchart TB
    c1-->a2
    subgraph one
    a1-->a2
    end
    subgraph two
    b1-->b2
    end
    subgraph three
    c1-->c2
    end

    one --> two
    three --> two
    two --> c2

render

subgraph 之間加上方向(direction 語法在 MarkText 不支援)

flowchart LR
  subgraph TOP
    direction TB
    subgraph B1
        direction RL
        i1 -->f1
    end
    subgraph B2
        direction BT
        i2 -->f2
    end
  end
  A --> TOP --> B
  B1 --> B2

Interaction

當 js 為 securityLevel='strict' 這個功能會被 disable,securityLevel='loose' 則會 enabled

click nodeId callback
click nodeId call callback()

可在 js 增加 callback() function 讓 mermaid node 使用

<script>
  var callback = function(){
      alert('A callback was triggered');
  }
</script>

Styling a node

可設定不同的 border,或 background顏色

flowchart LR
    id1(Start)-->id2(Stop)
    style id1 fill:#f9f,stroke:#333,stroke-width:4px
    style id2 fill:#bbf,stroke:#f66,stroke-width:2px,color:#fff,stroke-dasharray: 5 5

render

用 classDef 可更方便地定義新的 style class

classDef className fill:#f9f,stroke:#333,stroke-width:4px;
class nodeId1 className;
class nodeId1,nodeId2 className;
%% 用 ::: 可快速指定 node 的 style class
A:::className
flowchart LR
    A:::someclass --> B
    classDef someclass fill:#f96;

render

References

mermaid github

網頁流程圖函式庫 mermaid.js